



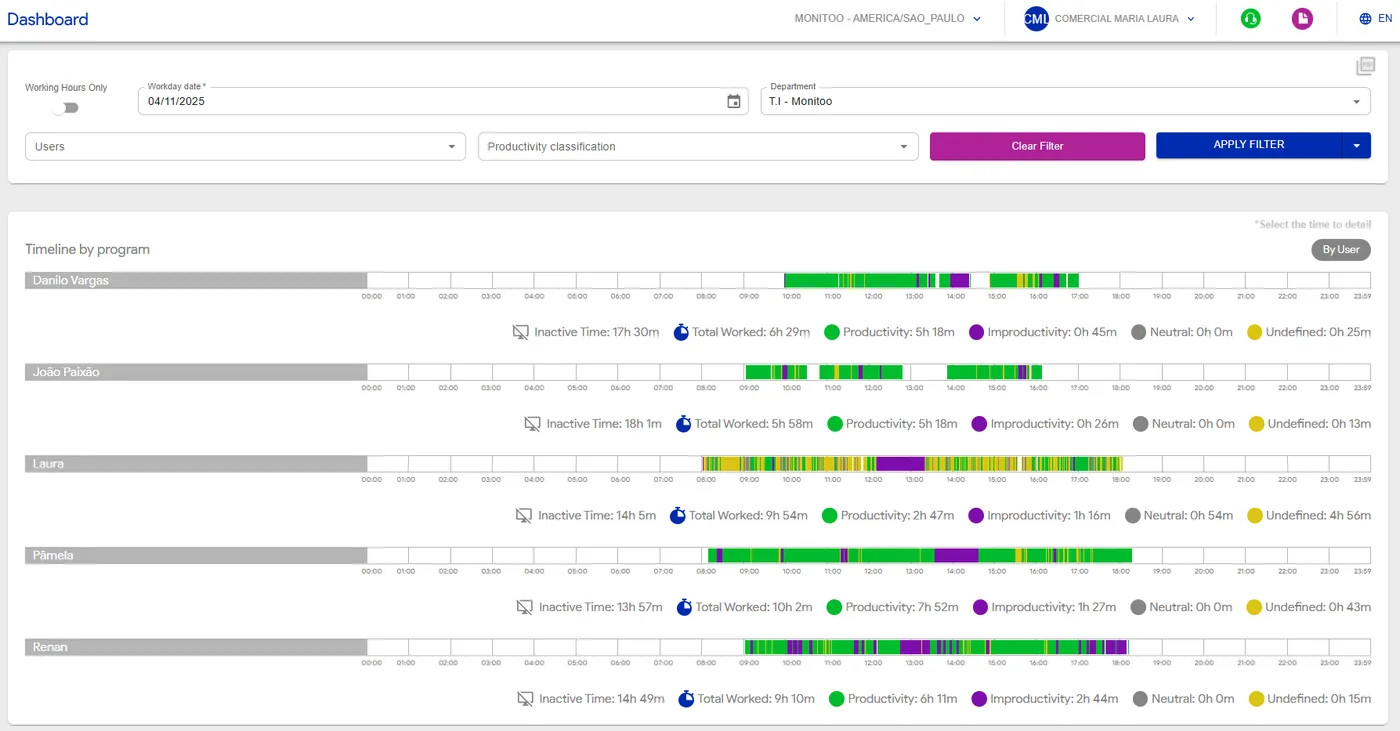
The Timeline section allows you to visually track everything employees have done during the day, in a clear and segmented layout.
You can filter the information by date, department, or user. When applying a filter, the system displays a “productivity ruler” — a linear graph that represents the workday with the following classifications: Productive (green); Unproductive (purple); Neutral (gray)
These categories indicate how website and program accesses are classified within the company.
This classification can be defined per user, department, or applied globally across the organization.
Undefined (yellow) represents accesses that have not yet been categorized as productive, unproductive, or neutral — meaning they are awaiting classification by the company.
In addition to the ruler, you can also view the total time worked and inactive time (moments without activity).
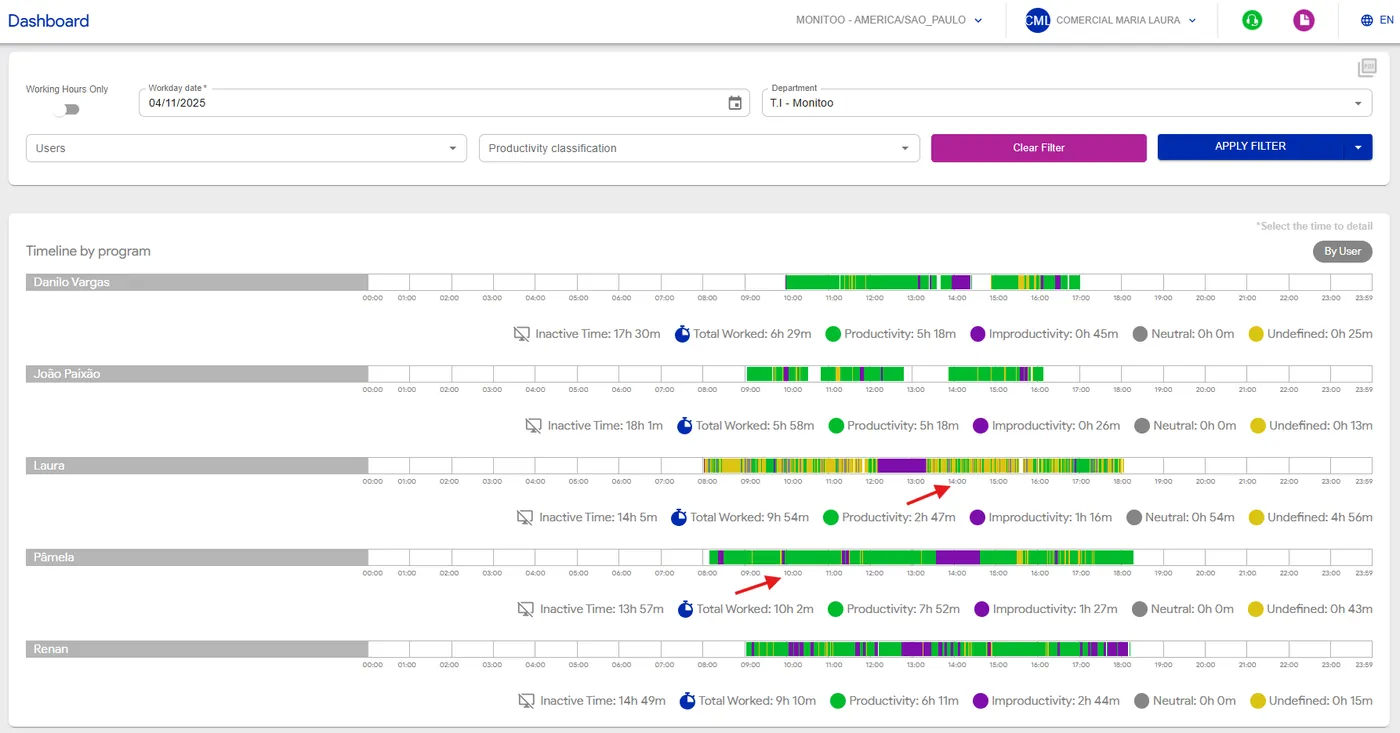
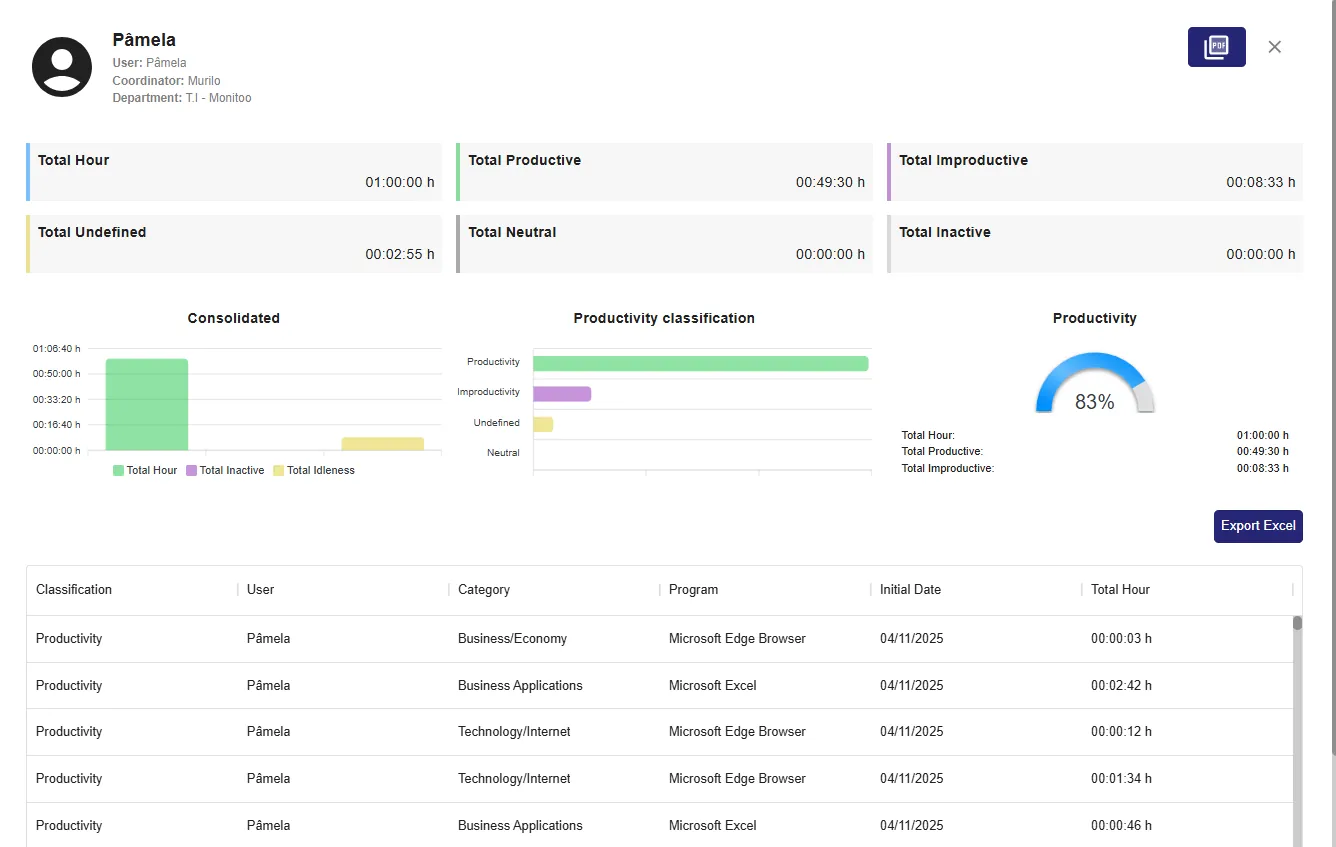
By clicking on any time shown below the timeline, a detailed pop-up opens, displaying complete information about the accesses made during that period — including the history of websites, programs, and usage intervals.
💡 Tip: Use the Timeline to identify focus patterns, breaks, or distractions throughout the day, and to gain a precise understanding of how your team’s time is being used.
You can export this report to Excel, as shown in the example below, to get a more detailed view of the information.
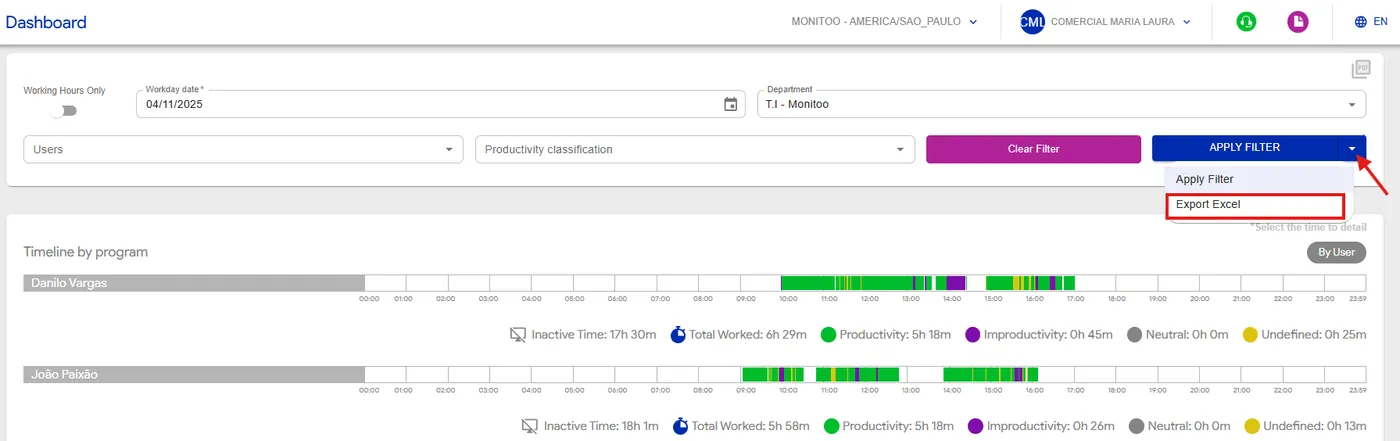
See how:
Great! Thanks for your feedback.
Tell our team what was missing: contact support on WhatsApp.
